The Canmore Real Estate Market 2019
Dear friends of Canmore,
I am sitting here in my office looking out onto an absolutely stunning Winter wonderland with an incredible blue sky, crystal clear cold air and the sun turning everything bright and golden. What a joy and blessing to be able to live here!
Last year at this time I predicted that Canmore 2019 would see a “stable price level with no or very little price increase and perhaps some more supply”.
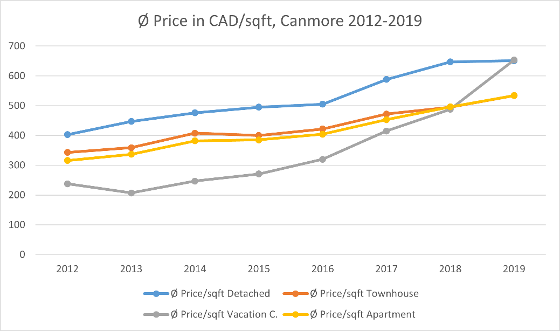
I was only partially right: Since 2010, the numbers of listings have been decreasing in Canmore and 2019 is the first year that sees this tendency turn around with a significant increase of supply over 2018 by 20% from 155 listings on average to 186 listings on average throughout the year. This turned only partially into 12% more properties sold in Canmore in 2019 than 2018 (518 Sales). However – average price/sqft above grade still increased by 7% (10% from 2017 to 2018) for the whole of Canmore. The numbers are very different for the different kinds of properties, so let’s take a closer look:
Detached Homes:
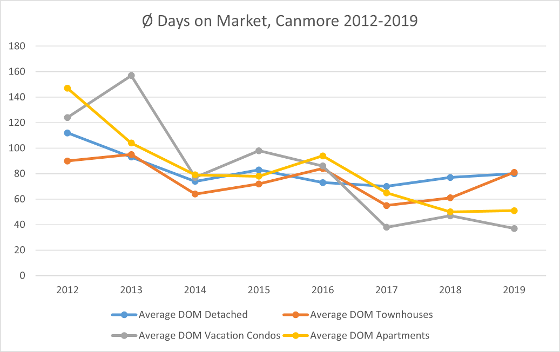
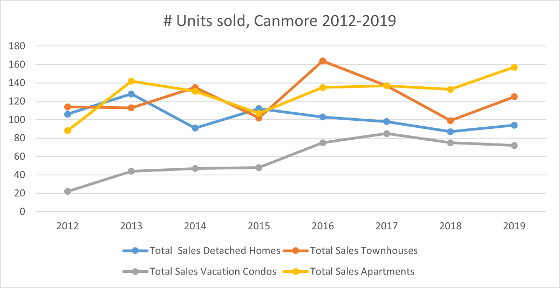
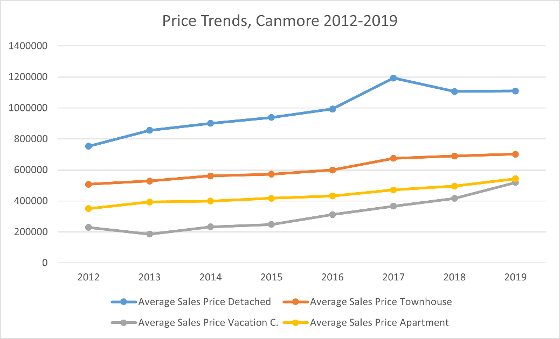
Price levels for detached homes stayed on almost the same level as 2018. 94 properties were sold which is 8% more than in 2018. The average sold price was $1,110,000 with an average price/sqft above grade of $651. ($647 in 2018). The average days on market were 80 compared to 77 in 2018. So overall not a big change.
Townhouses:
Price levels for townhouses increased very slightly by 2% from an average sale price of $690,000 to $702,000. Sales numbers increased by 26% to 125 townhouses sold. Average days on market increased from 61 days to 81 days.
Apartments:
Average sale prices for apartments increased by around 9% to an average sale price of $543,000. 157 apartments were sold, which is an increase of 18% over last year’s sales numbers. Days on market remained the same at 51 days.
Vacation Properties:
Against the odds, average prices for vacation properties that can be self-managed and rented out via Air B&B or VRBO still increased by another incredible 24%. The average sale price was at $519,000. Sales numbers remained stable at 72 units sold despite the price increase. The average days on market went down from 47 days to 37 days. (Most units sold much faster than that). Considering that vacation properties can hardly be financed, these numbers are quite surprising.
It could have been the increased prices for vacation condos, which in turn lead to a higher price level for apartments, as people cross-compare between similar products.
Summing up: 2019 was a good year for Real Estate in Canmore. There was about 20% more inventory than in 2017 and 2018 which lead to an increase in sales numbers by 12% despite the fact that prices for apartments and vacation properties still increased. Prices for detached homes and townhouses remained relatively stable.
Outlook into 2020:
Most of the sellers and buyers in Canmore in 2019 came from Alberta. The second largest group were buyers from other Canadian provinces (British Columbia, Saskatchewan, Ontario) and some people from overseas (USA, GB, other countries). Alberta suffered significantly from declining oil prices and although we have not seen any effect on the market in Canmore in the past, it remains to be seen if this could have some more effect in the long run. Disruptions in the world economy (in particular trade wars) could have an influence on Canada as a whole and further depress the general outlook for 2020. And although Canmore is somewhat in a bubble (potential buyers are not attracted by jobs or industry but by the environment and the life style that Canmore has to offer), we might feel marginal effects as well. I believe that some investors may also observe the world economy and investment climate and may want to sell in order to cash out on their assets. I do not anticipate prices for vacation properties to increase the way they have in the past, so that my outlook for 2020 is again a more balanced market with a slightly higher supply and therefore less pressure on prices, resulting in prices relatively stable for all market segments incl. vacation properties.
All numbers were taken from our local system here in Canmore which does not include private sales or sales by Calgary Realtors. But the criteria over the years have always been the same, so that changes in numbers are meaningful. (data for 2019 as per Dec. 27th)
The following pages contain charts which show trends in price, sales numbers and days on market and let you compare between the different products easily. Enjoy the data, but remember that while this can show general trends and tendencies, every property is different and when you want to buy or sell a property, you need to get more accurate information.
Talk to me if you have any questions concerning the data provided or if you are considering to sell in 2020 and would like to know the value of your property or if you are a buyer and looking for that ideal property!
I’d be happy to assist you!
Happy Holidays from your Canmore REALTOR, Thomas Krause - CanmoreThomas