Real Estate is one of the Hottest Topics in Canada These Days
Read the full blog for a 2022 Canmore real estate market review and a quick look at 2023
2021 was an incredible year in Real Estate with the markets running hot. After taking a deep plunge during the pandemic, the Canadian economy bounced back in 2021/2022 with strong growth and record-low unemployment.
This exuberance in the economy along with global pressures, led to arguably the most pressing economic issue of the year: decades-high inflation.
The Bank of Canada responded to rapidly rising prices with one of the fastest monetary policy tightening cycles in its history, setting the stage for a rockier year.
Since March 2022, the central bank has raised its key interest rate seven consecutive times, from 0.25 per cent to 4.25 per cent. That's the highest it's been since January 2008.
Canadians and businesses facing higher borrowing costs are expected to pull back on spending more noticeably in 2023. Economists expect that process to slow inflation, though how quickly, is unknown.
For real estate this could mean that elevated mortgage costs will price out first-time buyers and discourage potential sellers from trading up.
How did the increased interest rates affect the Canmore Real Estate market in 2022 and what can we expect for 2023? Let’s take a look.
IN SHORT:
Sales Numbers were down by about 30% in 2022 compared to 2021.
The average Days on Market for 2022 were 35 days.
The average price for a property in Canmore increased by 22% from $836,000 to $1,020,000.
The average price / sq. ft. total increased from $652/sq. ft. to 723/sq. ft.
The average number of listings in 2022 stayed at about the same low level as in 2021 at around 100.
Here at the details:
Sales Numbers
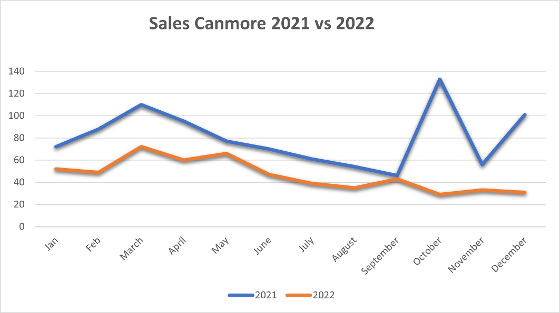
Sales in 2022 (represented by the red curve) were down by 42% compared to 2021 from 963 sales down to 556 Sales in total (down about 30% if we disregard the extra influence of some new development presales in 2021).
The first quarter was down by 36% but if we take out some new Three Sister Townhouse developments that are included in the numbers of 2021, sales were only about 30% down.
The second and third quarter were also about 30% down.
The last quarter was down 68%. However, 2021 saw r over 140 new hotel condo sales which were presale and unusual in this quarter. You can see this reflected in the two peaks of the blue curve in October and December. If we disregard those, sales numbers of the last quarter of 2022 were 37% below 2021. That’s still more of a decline than during the previous 9 months.
This can be explained at the beginning of last year with a lack of inventory because of the frenzy market in 2021. After March, the numbers of listings came up while sales numbers still declined. March marked the beginning of the increase of interest rates in Canada so that this result is not surprising.

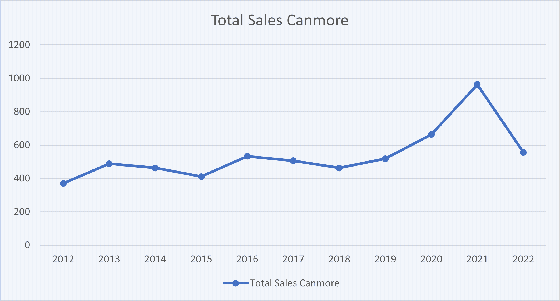
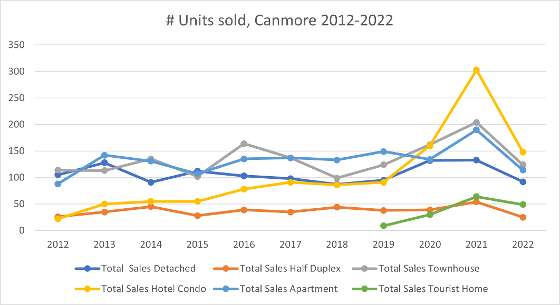
The next chart shows that sales numbers in 2022 overall were still good and even slightly higher (556) than sales numbers in 2019 (518) the last year before Covid.
The last quarter of 2022 shows weak sales numbers, and the market was very quiet in general. It remains to be seen if sales numbers for 2023 will be back at around 500 sales for the year as we have had over the last few years before Covid, inflation and interest rate increases.
Prices
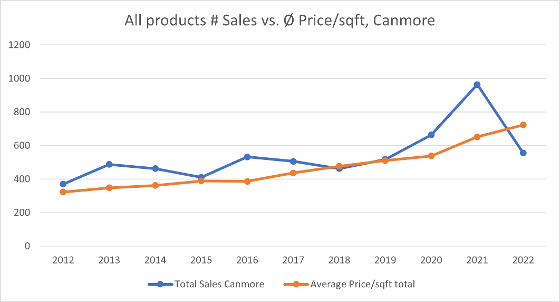
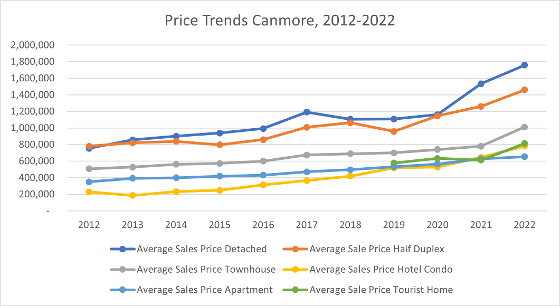
Prices in 2022 kept increasing when compared to 2021. The average property in Canmore sold at $1,019,000. That is a 22% price increase over 2021.

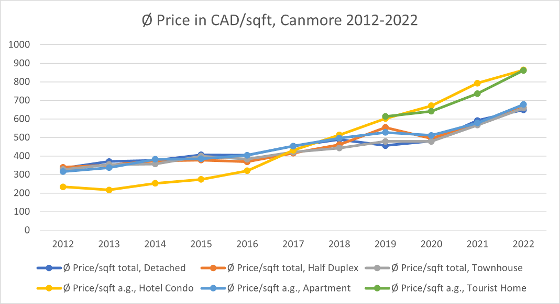
The chart below shows that while sales numbers fell sharply, the average price/sqft total over all real estate products here in Canmore (not incl. fractionals and lots) increased by 11% from $652 to $723/sqft.
Detached
The average sale price of detached homes increased by 15% from about 1.5 Mio. to $1,760,000. The average price/sqft total ranged at $649. Average Days on Market were 42 as compared to 60 in 2021.
Half Duplex
The average sale price of a Half Duplex in Canmore increased by 16% from 1,260,000 to 1,460,000. The average price/sqft total ranged at $660. Average Days on Market were 29 as compared to 47 in 2021.
Townhouse
Townhouse Prices (along with tourist home properties) increased the most by 30% from 780,000 to $1,013,000 on average. The average days on market were 31. The average price/sqft total was $658 which is an increase of only 16% compared to 2021. This could be an indicator that people also switched to larger properties.
Hotel Condo
The average sold price for a Hotel Condo (Visitor Accommodation Zoning) in Canmore in 2022 was $782,000. That’s about 21% higher than in 2021. The average days on market were 35. Average price/sqft above grade was $864 which is only a 9% increase over 2021. The assumption here is also a shift to bigger properties.
Apartment
Apartment sale prices increased by “only” 4% from 627,000 to 654,000 making it the most affordable real estate in Canmore. The average days on market were 34. The average Price/sqft total was $658.
Tourist Home
Tourist Home zoned properties (this kind of zoning allows short-term rentals, long-term rentals, or fulltime living) increased from an average sale price of 613,000 to 862,000 which at 41% marks the highest price increase for Canmore properties. This is most likely driven by the demand for short-term rental properties. Average Days on Market were 31.
When comparing prices/sqft we can see that short-term rental properties like hotel condos or tourist home zoned properties on average sold at a similar price of around $860/sqft above grade (all of these units are located above grade, so “above grade” here marks the measured size of the unit according to Residential Measurement Standards – the Alberta measuring standard).
Detached, Half Duplex and Townhouses sold at an average price price/sqft of between $650 – 680/sqft total.
Price Development
In total the average price in Canmore in 2022 was 22% higher than 2021. It increased from $836,000 in 2021 to $1,019,000 in 2022. However, when we look at how the price developed over the period of last year, we notice that it slightly decreased from the 3rd quarter to the 4th quarter. This would indicate that prices softened to a certain extent during the last quarter of 2022.
These numbers must be regarded with certain skepticism. Statistically, the numbers are not very well founded as the actual sale numbers for each quarter are small. Calculating an average on a small number of incidents means that outliers can have a strong effect. There might not be enough occurrences (sale numbers) during every quarter to reflect the price development accurately (law of large numbers).
What is obvious is that while prices may be softening somewhat, this could be seasonal, and we are not observing a massive price erosion or a major price decline.

Days on Market
Since 2012, days on market have continuously been decreasing and 2022 marked the year with the fastest sales on average. Average days on market for Canmore in 2022 were 35 days as compared to 41 days in 2021.

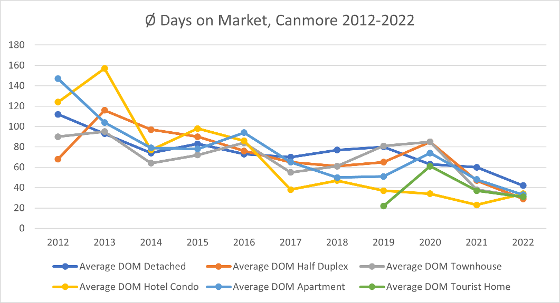
Shortest days on market on average were Half Duplex properties with 29 days followed by Town House and Tourist Home with 31 days, Apartments with 34 days, Hotel Condos with 35 days and detached with 42 days.
Listings
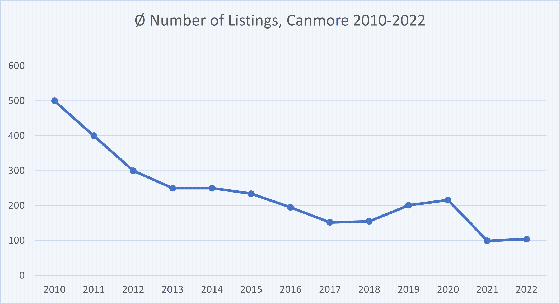
The average number of listings for 2022 was almost unchanged from 2021 with 100 listings on average. At this moment, Canmore has around 80 listings. To set this in perspective: In 2019 – the last year before Covid the number of listings on average was double at 200. In 2012 (10 years ago) it was 300 and in 2010 we even had around 500 listings on average.
Outlook
High mortgage rates are reducing affordability and are leading to a lower demand pressuring prices. Will home prices crash after the strong run-up in prices across the country over recent years?
I don’t think so.
There has recently been a lot of positive data for Canada and Alberta:
- We have a strong labour market with job growth and migration.
- Loans are less risky than they were a few years ago.
- The Mortgage delinquency rate is at 3.6%, holding at a historical low
- Foreclosure rates for Canada are at a historical low at 0.6%.
Canada has a massive housing shortage from a decade of underproduction in the housing market and here in Canmore we have also been seeing a pullback in listings again. The inventory is tight with only around 80 listings, and we are not seeing much coming to the market now. New development is very limited due to our geographical conditions.
Foreclosure and mortgage losses are not expected to be material. Canmore with typically financially strong buyers has never seen a lot of those plus there has been a substantial amount of equity build-up since the start of the pandemic.
In this market, sellers are not willing to compromise and price levels have mostly been remaining stable for now.
The following chart shows the ratio between Sale Price to List Price for 2022. A ratio of “1” means that the Sale Price equals the List Price.

Consequently, I don’t expect prices to curb during the first quarter of 2023.
Another 0.25% interest rate increase is expected at the end of January with another 0.25% interest increase to follow. But the initial interest shock is now behind us, and it seems like consumers have started to wrap their heads around the higher borrowing costs. The bank of Canada will be monitoring data and will increase rates at a far less aggressive pace in 2023 than last year.
New listings in Canmore usually come up in March and along with the anticipated higher rates, this could soften prices, but it would be a gradual process and it’s not at all certain as Canmore has always been a sought-after market. As soon as prices soften, motivated buyers who have been waiting typically jump in, reversing the effect.
I wish I had a glass ball, and nothing is for certain. Only so much is clear: We will have very interesting times ahead of us.
Thomas Krause – CANMORETHOMAS | REALTOR RE/MAX Alpine Realty
Canmore 13.01.2022


