


Canmore’s challenged Real Estate Market in the Third Quarter of 2022
What you need to know to navigate the market right now!
A raging virus, a war in Europe, rising inflation; investors, politicians and decision makers worldwide are finding it more and more challenging to navigate our fast-changing worldwide economies. What is happening worldwide and nationwide also has a direct effect on every single person locally. We are all past, present or future homeowners and a real estate transaction can easily be the biggest transaction of our lives. More than ever, we need to know what’s happening in our local markets to make the right decisions. Decisions today are harder to make than in the past, but will have lasting consequences in future years.
The Governor of the Bank of Canada, Mr. Tiff Macklem held a speech on October 6th, 2022 before the Chamber of Commerce in Calgary. During his speech he stressed the necessity of another interest increase to slow down inflation. Specialists estimate that there is a good chance for another 1% increase now before the end of the year which would bring the rate up to 4.25% (or to a min. of 4%).
Lenders will react promptly and increase their interest rates. This does not come unexpected but will further shake up the real estate markets. Experts expect fixed rates to increase as well and to settle at 1% higher than they are now by year end to approx. 5.5 - 6%.
So where are we now here in Canmore, Alberta and what could this mean for the future of the Canmore real estatemarket?
The chart below shows property sales numbers in Canmore from Jan. 2019 until the end of September 2022. We saw a huge dip in April 2020 as a result of the news of Covid followed by an incredible recovery with its peak at the turn of 2020 to 2021. (To learn more about the background please refer to this blog published in March 2021: https://canmorethomas.com/blog.html/recovery-of-the-canmore-real-estate-market-in-2020-7548362)
The year 2021 was incredibly active with record sales numbers: 884 sales in the year as compared to 522 sales in 2019 (plus 69%) often resulting in multiple offers and massive price increases (I am breaking down price trends soon, keep reading). However, we are already starting to see that the trend shifts from increasing sales numbers to decreasing numbers. In March 2022, the bank of Canada – driven by rising inflation - announced it’s first rate increase (followed by 4 more rate increases up to date) and in May 2022 we are seeing the beginning of a clear downward trend in sales numbers in Canmore. In summer this year, sales numbers dropped below numbers of 2020 and even 2019.
*1 = April 2019 incl. 29 new Distinctive Home Developments
*2 = Nov. 2020 incl. 50 units new Skyline Development (Visitor Accommodation, short-term rental)
*3 = Dec. 2021 incl. 59 units new Cascade Development (Visitor Accommodation, short-term rental)
When comparing the periods Jan.- Sept. 2019 to Jan. – Sept. 2022 we see that at this moment the accumulated sales numbers are still above the level of 2019 which was the last year before Covid and a “normal” year.
We are also still above 2020 numbers, but this will change soon. In 2020, sales were down in the second quarter but made a huge recovery after May and had an extremely strong last quarter.
In other words, sales numbers this year will clearly be below 2021 (minus 31% until September) and 2020. Sales numbers so far are still slightly higher than in 2019, but this could still change during the last quarter. With another interest hike anticipated and a lot of buyers hesitating, sales numbers could drop further.
Here is another chart, looking at Canmore’s sales numbers from Jan. to Sept. this year. The beginning of a downward trend after March 2022 is clearly seen.
Let’s take a look at the different types of properties. Let’s say you own a detached house and you would like to know how sales numbers for detached properties changed since 2019.
The following chart is comparing the time period from Jan – Sept. of 2019 all the way to 2022 for several type of properties. Keep in mind that 2020 still made a big jump after September.
What’s remarkable is that hotel condos for short-term rental (here called “Visitor Accommodation” based on their zoning) saw a huge increase in sales numbers and have been remaining on this level until present.
Sales numbers of townhouses and detached properties dropped down to pre-Covid levels 2019 whilst apartments and half- duplexes dropped below 2019 levels.
A lack of supply of properties restricted sales over the last two years. Sales would have been significantly higher if supply had been sufficient. Below is a chart which shows how supply was at a peak in August 2020. As the Covid effect decreased, supply continuously decreased until it reached the bottom in January 2022 with only around 40 listings in all of Canmore.
It is normal that listings drop towards the end of a year and increase again at the beginning of the following one, however, the increase that we have been seeing is continuous. It is unusual and brought us back to the level of November 2020. It could reach levels of 2019 or higher if the trend continues.
With interest rates increasing followed by a decreasing demand and an increase in supply one would expect market adjustments in form of lower sales prices. Let’s take a look…
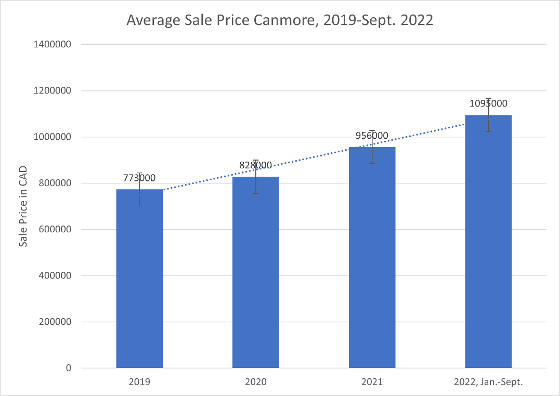
The chart shows the average sale prices for a property in Canmore from 2019 to September 2022. Between now and 2019 we have seen a price increase of 42%.
A 7% increase in 2020 over 2019 followed by 15% in 2021 and a 14% increase in 2022 but always based on the previous year’s increased level so that the total increase was higher than the total of the separate percentages.
The average price of a property in Canmore is presently $1,095,000.
How did the price increase effect the different properties? Which form of property gained most and which the least?
Let’s take a look:

Detached properties gained the most. From 2019 to 2022 average prices for single family homes in Canmore increased by a stunning 56%. Short-term rental properties, hotel condos (zoned Visitor Accommodation) saw prices increase by 46%.
The third strongest group were duplex and townhouses in Canmore with 43%. Prices for apartments increased by 23% from 2019 to 2022.
And although we have been seeing quite a few price corrections over the last few months, Jan-Sept. prices in 2022 are still way higher than they were in 2021.
I expect prices to stabilize or decrease so that by the end of the year we’ll be closer to price levels of 2021. (Note that the average prices for September were above this year’s average sale price of $1,095,000).
It shows that Canmore is quite a stable market with strong prices. Prices are not very elastic. They will adjust downwards, but they do so slowly.
Summing up:
There is more supply coming to the market, but prices remain relatively stable for now. Sales numbers have been going down. October is traditionally a strong month with a lot of sales. It remains to be seen how this plays out this year and if we fall below sales levels of 2019.
Contact me with all your real estate questions! Do remember, that every property is different and that general changes in market value can vary for different properties. Contact me if you are considering buying or selling and if you would like to know what your property is worth now.
October 7th, 2022
THOMAS KRAUSE – CanmoreThomas | REALTOR
RE/MAX Alpine Realty
Cell: 403-678-7653
canmorethomas@gmail.com