RSS

2021 - The Whopper Year of Canmore Real Estate


The title is giving it away…. 2021 was a record-breaking year in Real Estate in so many ways:


> Highest Sales Number
> Highest Absolute Prices
> Highest Price Increases


We have had positive numbers in every market segment and over every category except for one:


>  Lowest number of listings ever!


And that’s a real concern for the many buyers that have been trying to get a foot into the Canmore market but couldn’t. But let’s take a look at the sales numbers first and then look at listings at the end of this report when we cover the Outlook for 2022. 
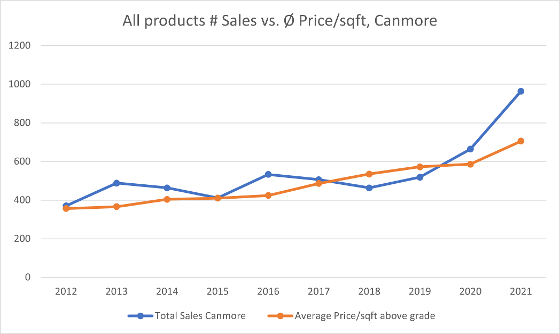

The graph shows yearly sales numbers in Canmore since 2012 in blue and an impressive increase in sales numbers of 45% in 2021 over 2020. The orange curve reflects how the average price/sqft increased by 20% to $705/sqft over the last year.


A closer look at the years 2019 (the last year before Covid) until 2021 shows how sales came to a low point in April...

Read

The unreal Recovery of the Canmore Real Estate Market in 2020

Welcome to 2020 – the year of Covid! When at the beginning of the year Covid started to appear on the horizon, nobody here in Canada or Europe was really taking it very serious. And I remember several discussions that I’ve had with friends and relatives about this topic. Having experienced SARS several years back when I was still living in China, I had quite a different opinion from most of my friends on how serious this could become for us.


In May of this year, we had seen the first lockdowns and the Real Estate Market reflected what was happening all over. Sales numbers in Canmore were down by 44% compared to 2019 and the future looked grim.


But then something happened and miraculously demand for Real Estate came back. By the end of December we had 658 sales, which is 27% more sales than in 2019.


The reasons for this are still not entirely clear to me, but here are some possible explanations:

 Essential Business:...

Read

Is the Canmore Real Estate Market starting to recover?

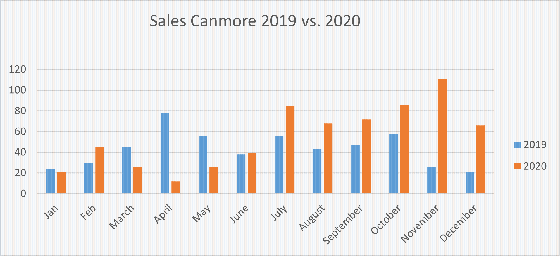
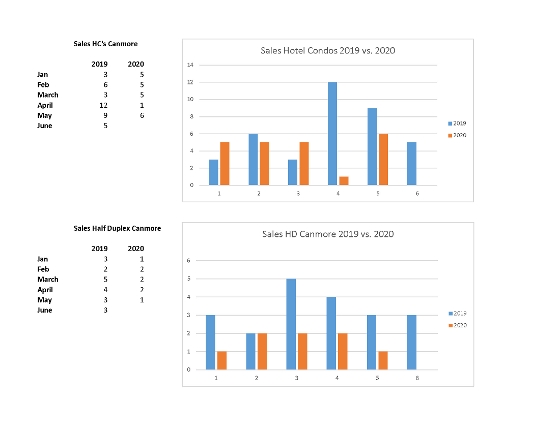
 Comparing the sales data from 2019 with 2020 it sure looks like it! April 2020 shows a huge difference between 2019 and 2020 but May looks more promising. Interestingly prices have not come down except perhaps for a handful of hotel condo properties which sold quickly. Overall prices have remained rather stable. The amount of listings has not overly increased. 

I will keep you posted as soon as the data for June is in! 

Read

The Canmore Real Estate Market – First quarter of 2020 and Outlook


1st Quarter 2019

1st Quarter 2020

Average number of listings


168

210 (+25%)

Average list price


987,000

1,089,000 (+10%)

Number of Sales


99

93 (-6%)

Average sale prices


731,000

738,000 (+1%)


March 2019

March 2020

Average number of listings


172

215 (+25%)

Average list price


969,000

1,095,000 (+13%)

Number of Sales


44

27 (-39%)

Average sale prices


755,000

771,000 (+2%)


The average Number of Listings in the first quarter of 2020 as compared to 2019 is up by 25%. However March listings are also up by only 25%. >>>> That’s in the average…..there is no further increase of listings as of now. (Note that there are 4 times as many hotel condos listed in the first quarter of 2020 then there were listed in 2019.)


The average List Price of the first quarter of 2020 over the same period in 2019 was up by 10%. The average list price for March was up 13%. >>>> We have not seen...

Read

The Canmore Real Estate Market 2019


Dear friends of Canmore,


I am sitting here in my office looking out onto an absolutely stunning Winter wonderland with an incredible blue sky, crystal clear cold air and the sun turning everything bright and golden. What a joy and blessing to be able to live here!


Last year at this time I predicted that Canmore 2019 would see a “stable price level with no or very little price increase and perhaps some more supply”.


I was only partially right: Since 2010, the numbers of listings have been decreasing in Canmore and 2019 is the first year that sees this tendency turn around with a significant increase of supply over 2018 by 20% from 155 listings on average to 186 listings on average throughout the year. This turned only partially into 12% more properties sold in Canmore in 2019 than 2018 (518 Sales). However – average price/sqft above grade still increased by 7% (10% from 2017 to 2018) for the whole of Canmore. The numbers are very different...

Read

New Mortgage Rules starting Jan. 2018

Starting January 1st, 2018 all mortgages will be required to qualify at the posted 5 year rate, or at this time approximately 4.89%. Currently mortgages with 20% or more can qualify at the regular 5 year rate of approximately 3%. The difference can reduce mortgage amounts by approximately 20%.

If you are interested in buying and have not been pre-approved for the new stress test, now might be the time to do so to find out, what the difference would be for you and if you should make a move before the deadline at the end of this year.

Below is a link to the government's website detailing the changes. Feel free to call or email if you have any questions or concerns!

http://www.osfi-bsif.gc.ca/Eng/osfi-bsif/med/Pages/B20_dft_nr.aspx

Read

The Canmore Real Estate Market – Past, Present and Future

The decline of the price of crude oil which started internationally in August 2014 had a huge influence on the economy of Alberta and Calgary. While the price was previously at around $100US / barrel crude oil, the price dropped to its lowest at around $30 in February 2016 and has since started to recover to around $54 US in Dec. 2016.

Alberta’s economy which depends heavily on the oil industry has been hit with unemployment which lead to a negative net migration. People previously employed in the oil industry left Alberta and went back to their home provinces. The spending budget of many of those who stayed decreased sharply.

This development was also reflected in the Real Estate Market. With a lot of properties coming on the market but less people to look for properties, the Sales Volume in Calgary declined in Nov. 2016 by 3% year over year and was down by 17% when compared to long-term averages. Sales Prices decreased...

Read

Finance Minister Bill Morneau announced today that to "address emerging vulnerabilities in certain housing markets, while not overburdening other regions" the down payment requirement will be modified on purchases that exceed $500,000. 

Beginning in February, insurers will require a 10% down payment on the portion of any mortgage over $500,000. The five per cent rule remains the same for the portion under $500,000. This means that someone looking to buy a $750,000 home would need to have a total minimum downpayment of $50,000 (which is five per cent of $500,000 plus 10 per cent of the remaining $250,000). 
Read

Five things to watch after the Bank of Canada's latest rate cut


The decision that practically gripped the nation came down this morning, as Bank of Canada Governor Stephen Poloz decided to cut interest rates once more. The first of his cuts came more abruptly when in January of this year, the BoC shaved 25 basis points off what was thought to be a stable 1 per cent; it was the first rate cut since April, 2009, and was a direct response to the steep drop in oil prices.


Wednesday's rate cut to 0.5 per cent was less of a surprise as the economy has not rebounded as the central bank expected. Now, not only did the BoC cut its rates, but it dramatically lowered its growth projections for the rest of the year.


Below are five things to watch out for after the interest rate cut.


How will the banks react?


The question now is whether the banks will follow suit and cut their own prime rates in response to the rate cut - and by how much. Toronto-Dominion Bank was the...

Read

Canmore Real Estate Market, June 1st 2015


Canmore had 145 closed deals from January to May 2015 as compared to 207 in the same period in 2014. That is a 30% reduction in closed deals compared to last year.

The number of listings on the other hand increased from around 200 in January to 264 in June which is more than we saw during the year 2014.

While the average sales price of apartments was $399,000 in 2014, the average sales price from Jan-May 2015 was $369,000. Remarkable however, that the average price in 2015 increased constantly from 315,000 in January to 433,000 in May. Days on market reduced from 76 in 2014 to 56 in 2015. There is obviously a strong demand with very little supply for lower priced apartments and this drives prices for this kind of product.

While the average sales price of vacation properties was $214,000 in 2014, the average sales price from Jan-May 2015 was $218,000. Remarkable here that the average sales price decreased from March 2015 to May 2015. Days on...

Read